Business
The JAP is Specialist Energy Company, which expresses its Business Interest in achieving Sustainable Solutions in Business Verticals:
Renewable
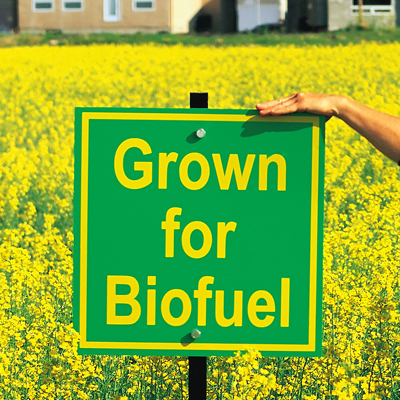
- BioEnergy (Biofuels)
- BioEthanol
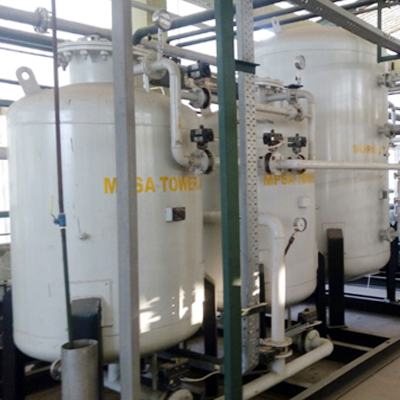
- BioCNG
- BioGas
- BioCO2
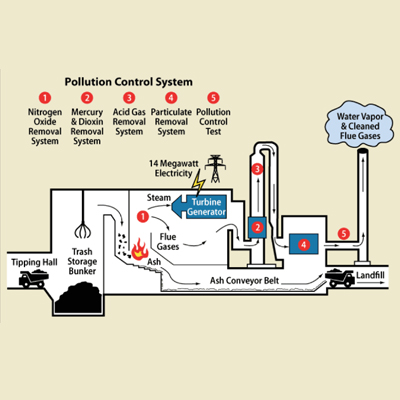
- Waste 2 Energy
- MSW
- Landfill remediation -transferring to energy
- Plastic & Rubber
- Green Power
- Biogas Power
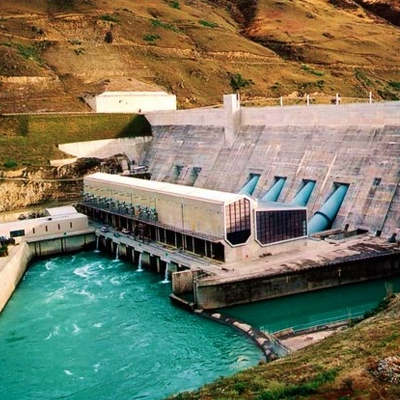
- Hydro Power
- Hydrokinetics
- Archimedean screw
Smart Mobility
- Carbon neutral mobility
- Overhead Rapid Transport
- Air conditioned, Wi-Fi, Modern
- Auto-mobile Fuel
Innovation
- Fuel Cell (Hydrogen)
- Eco+, People+
- Inner Engineering
Renewables
JAP main business focus is on the Renewable source of energy, in tune to company's business philosophy for People-Planet-Prosperity (P3) and embedded with excellent sustainability credentials. This Business vertical has three main portfolios, which represent the current business interests alongwith in pipeline scale up business action plans.
Biofuels
Waste to Energy
Hydro Energy
Smart Mobility
Clean Fuel
Trans Mobility